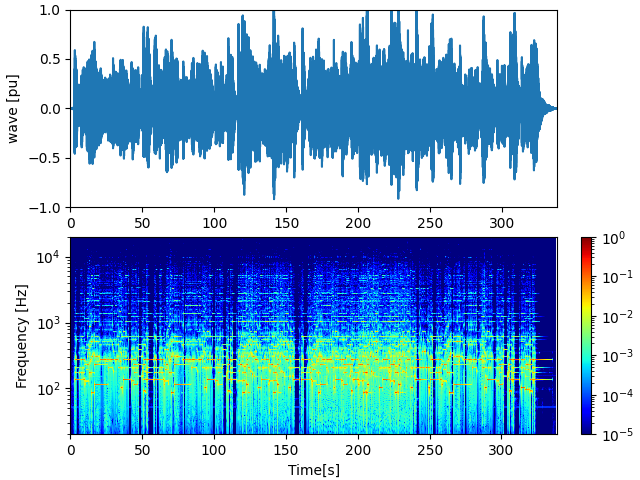
import numpy as np
import scipy.signal
import matplotlib.pyplot as plt
import matplotlib.colors as colors
from mpl_toolkits.axes_grid1.inset_locator import inset_axes
import soundfile as sf

def wav_read(path):
    wave, fs = sf.read(path) #音データと周波数を読み込む
    return wave, fs

path_to_wavfile = r"C:\foobar.wav"

if __name__ == "__main__":
    wave, fs = sf.read(path_to_wavfile)
    print(wave.shape)
    print(len(wave.shape))

    if(len(wave.shape) == 1):
        print('モノラルの wave file です')
    elif(wave.shape[1] == 2):
        print('ステレオの wave file です')
        #wave = np.mean(wave, axis=1) # ステレオをモノラルに変換する場合
        waveL, waveR = np.hsplit(wave, 2) # ステレオの片方の ch を抜粋する場合
        #print(waveL)
        wave = waveL.reshape(-1)


    frq, t, Pxx = scipy.signal.stft(wave, fs=fs, window='blackman', nperseg=44100, noverlap=None)
    # 周波数、時間、強さの3つの情報が帰ってくる

    Pxx = (np.abs(Pxx))*2
    #print (frq)
    #print (t)
    #print (Pxx)

    # プロットエリアの用意
    fig = plt.figure()
    ax1 = fig.add_subplot(2,1,1)
    ax2 = fig.add_subplot(2,1,2)

    # 生波形
    ax1.plot(np.arange(len(wave))/fs, wave)
    ax1.axis('tight')
    ax1.set_ylabel('wave [pu]')
    ax1.set_xlim(0, len(wave)/fs) # 時間範囲を設定
    ax1.set_ylim(-1, 1)

    # STFT のコンター(contour) 図
    norm=colors.LogNorm(vmin=1e-5, vmax=1)
    img2 = ax2.imshow(Pxx, origin='lower', cmap='jet', extent=(0, np.max(t), 0, fs/2), norm=norm)
    ax2.axis('tight')
    ax2.set_ylabel('Frequency [Hz]')
    ax2.set_xlabel('Time[s]')
    #ax2.set_xlim(160,200) # 時間範囲を設定したいとき
    ax2.set_ylim(20,20000) # 周波数範囲を設定したいとき
    ax2.set_yscale('log')


    # カラーバーを位置調整しつつ追加する。
    # 1.05 で右にはみ出させている。
    axins = inset_axes(ax2,
                       width="2%",  # width = 2% of parent_bbox width
                       height="100%",  # height : 100%
                       loc='lower left',
                       bbox_to_anchor=(1.05, 0., 1, 1),
                       bbox_transform=ax2.transAxes,
                       borderpad=0,
                       )
    cbar2 = fig.colorbar(img2, cax=axins)

    # 描画マージン(画面の Subplot configuartion tool で調整できるもの)
    # 最終的な描画サイズに合わせて数値調整する必要がある。
    plt.subplots_adjust(left=0.11, bottom=0.095, right=0.87, top=0.98, wspace=0, hspace=0.15)
    #fig.tight_layout()

    # 描画
    plt.show()
    plt.close()
# ref https://heartstat.net/2018/11/13/python_stft/

# ref https://matplotlib.org/3.4.1/gallery/axes_grid1/demo_colorbar_with_inset_locator.html#sphx-glr-gallery-axes-grid1-demo-colorbar-with-inset-locator-py
|


